library(gsheet)
final_df = gsheet2tbl("https://docs.google.com/spreadsheets/d/1BymEWPRq0ERQ3umD5IOvtK-wa4NMoq4C/edit?usp=sharing&ouid=116573839171815179218&rtpof=true&sd=true")After selecting the climate variables, they were applied in a logistic model, and the model’s performance metrics were evaluated.
Logistic model
Example of a model: consider changing the threshold and other climate variables.
library(rms)
library(rmda)
library(pROC)
library(caret)

final_df$e_aNULLlibrary(rms)
dd <- datadist(final_df)
options(datadist = "dd")
m_logistic <- lrm(epidemic ~PRECTOTCORR_14_23 + e_a_10_19,data = final_df, x=TRUE, y=TRUE)
summary(m_logistic) Effects Response : epidemic
Factor Low High Diff. Effect S.E. Lower 0.95
PRECTOTCORR_14_23 2.5535 6.6008 4.04720 -0.024322 0.19108 -0.39883
Odds Ratio 2.5535 6.6008 4.04720 0.975970 NA 0.67110
e_a_10_19 1.8623 2.2711 0.40876 -0.523650 0.26426 -1.04160
Odds Ratio 1.8623 2.2711 0.40876 0.592360 NA 0.35289
Upper 0.95
0.3501900
1.4193000
-0.0056997
0.9943200plot(Predict(m_logistic),conf.int = TRUE)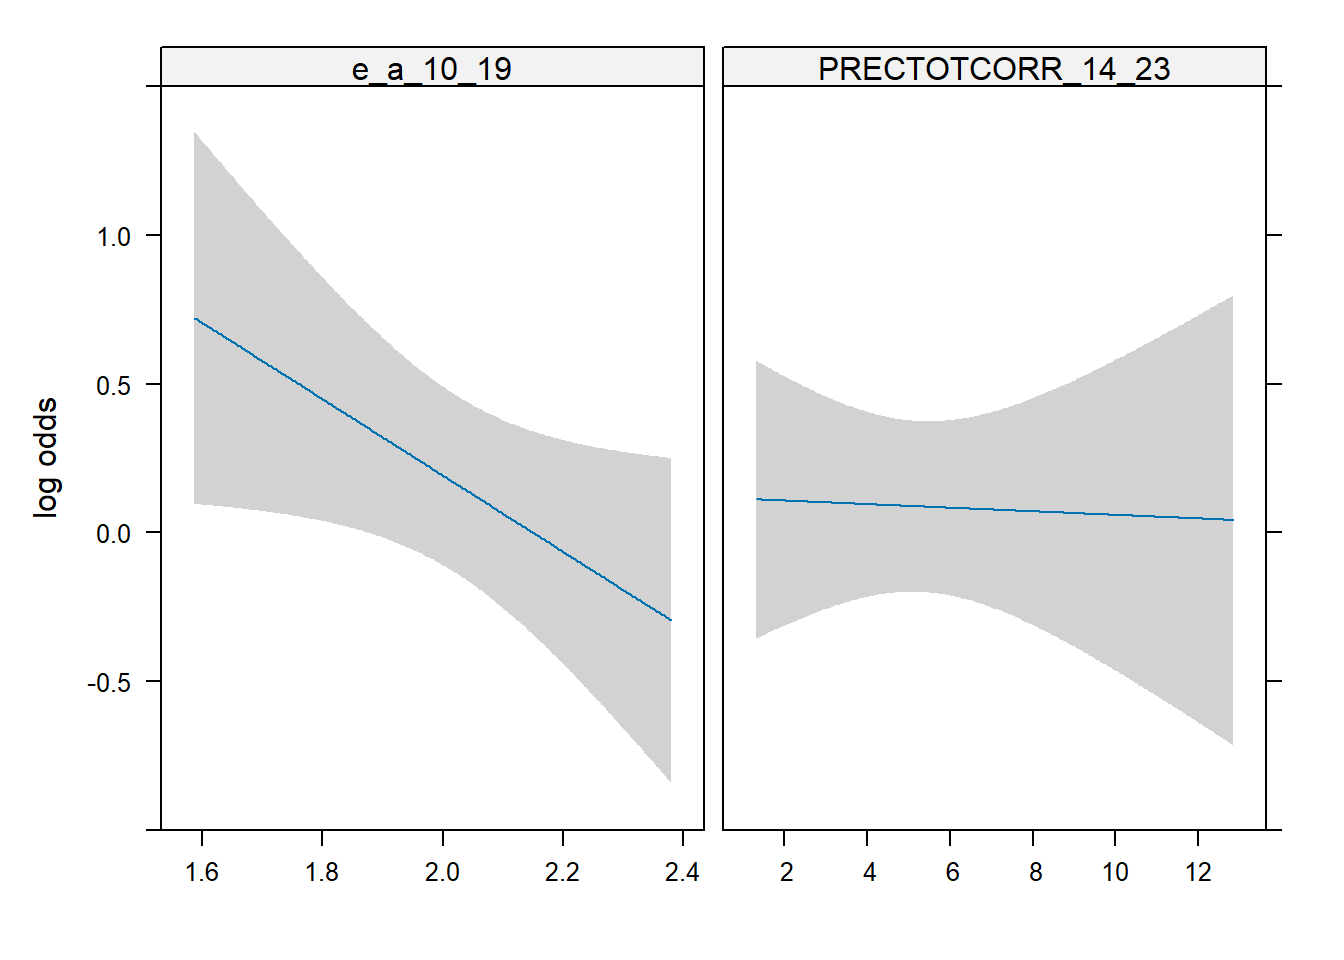
pred <- predict(m_logistic, final_df, type = "fitted")
final_df$epidemic <- as.numeric(as.character(final_df$epidemic))
compare <- data.frame(1, final_df$epidemic, pred)
library(PresenceAbsence)
optimal.thresholds(compare)
Method pred
1 Default 0.5000000
2 Sens=Spec 0.5200000
3 MaxSens+Spec 0.5800000
4 MaxKappa 0.5800000
5 MaxPCC 0.5800000
6 PredPrev=Obs 0.5100000
7 ObsPrev 0.5309278
8 MeanProb 0.5309278
9 MinROCdist 0.5200000
10 ReqSens 0.4500000
11 ReqSpec 0.6000000
12 Cost 0.5800000library(caret)
confusionMatrix(data = as.factor(as.numeric(pred > 0.76)), mode= "everything", reference = as.factor(final_df$epidemic))Confusion Matrix and Statistics
Reference
Prediction 0 1
0 90 103
1 1 0
Accuracy : 0.4639
95% CI : (0.3922, 0.5368)
No Information Rate : 0.5309
P-Value [Acc > NIR] : 0.9738
Kappa : -0.0103
Mcnemar's Test P-Value : <2e-16
Sensitivity : 0.9890
Specificity : 0.0000
Pos Pred Value : 0.4663
Neg Pred Value : 0.0000
Precision : 0.4663
Recall : 0.9890
F1 : 0.6338
Prevalence : 0.4691
Detection Rate : 0.4639
Detection Prevalence : 0.9948
Balanced Accuracy : 0.4945
'Positive' Class : 0
library(pROC)